
Case study: maintenance schedule
This case study illustrates the use of the staircase package to create the union of intervals, to remove overlaps between them. In this example we have an asset composed of several components, named A, B, C, D and E. Each of these components can undergo multiple periods of maintenance, as specified in a maintenance schedule If any component is under maintenance then the entire asset is considered under maintenance. The problem is essentially to create the union of the intervals specified in the maintenance schedule.
The data used is this case study is synthetic and fictional. Both data and the notebook for this tutorial can be obtained from the github site.
[1]:
import pandas as pd
import staircase as sc
import matplotlib.pyplot as plt
We begin by importing the maintenance schedule data into a pandas.DataFrame instance. Each row corresponds to a period of maintenance for a component. The first column identifies the component and the second and third columns indicate the start and end points of each maintenance period.
[2]:
data = pd.read_csv("./data/maintenance_schedule.csv", parse_dates=['start', 'end'], dayfirst=True)
data
/home/docs/checkouts/readthedocs.org/user_builds/railing/envs/v1.6.4/lib/python3.8/site-packages/ipykernel/ipkernel.py:283: DeprecationWarning: `should_run_async` will not call `transform_cell` automatically in the future. Please pass the result to `transformed_cell` argument and any exception that happen during thetransform in `preprocessing_exc_tuple` in IPython 7.17 and above.
  and should_run_async(code)
[2]:
| component | start | end | |
|---|---|---|---|
| 0 | A | 2020-01-12 12:00:00 | 2020-01-14 16:30:00 |
| 1 | B | 2020-01-13 19:30:00 | 2020-01-14 20:00:00 |
| 2 | C | 2020-01-12 08:30:00 | 2020-01-14 23:30:00 |
| 3 | D | 2020-01-12 12:00:00 | 2020-01-14 20:00:00 |
| 4 | E | 2020-01-12 12:00:00 | 2020-01-14 09:30:00 |
| 5 | A | 2020-03-07 10:00:00 | 2020-03-08 23:30:00 |
| 6 | B | 2020-03-07 22:30:00 | 2020-03-08 21:00:00 |
| 7 | C | 2020-03-07 17:30:00 | 2020-03-09 07:00:00 |
| 8 | D | 2020-03-08 08:30:00 | 2020-03-08 18:30:00 |
| 9 | E | 2020-03-07 07:30:00 | 2020-03-09 04:30:00 |
| 10 | A | 2020-05-03 18:30:00 | 2020-05-05 15:30:00 |
| 11 | B | 2020-05-05 06:30:00 | 2020-05-06 05:00:00 |
| 12 | C | 2020-05-05 02:00:00 | 2020-05-06 14:00:00 |
| 13 | D | 2020-05-05 06:30:00 | 2020-05-06 09:30:00 |
| 14 | E | 2020-05-03 14:00:00 | 2020-05-06 18:30:00 |
| 15 | A | 2020-07-16 12:30:00 | 2020-07-17 09:30:00 |
| 16 | B | 2020-07-16 02:00:00 | 2020-07-18 17:00:00 |
| 17 | C | 2020-07-15 05:00:00 | 2020-07-17 16:30:00 |
| 18 | D | 2020-07-15 22:30:00 | 2020-07-18 06:30:00 |
| 19 | E | 2020-07-15 08:30:00 | 2020-07-17 02:30:00 |
| 20 | A | 2020-09-19 15:30:00 | 2020-09-21 13:00:00 |
| 21 | B | 2020-09-20 12:30:00 | 2020-09-22 06:30:00 |
| 22 | C | 2020-09-20 16:00:00 | 2020-09-21 20:00:00 |
| 23 | D | 2020-09-19 19:00:00 | 2020-09-22 17:00:00 |
| 24 | E | 2020-09-20 19:30:00 | 2020-09-21 06:00:00 |
| 25 | A | 2020-11-21 08:00:00 | 2020-11-22 15:30:00 |
| 26 | B | 2020-11-20 23:00:00 | 2020-11-23 14:00:00 |
| 27 | C | 2020-11-20 23:00:00 | 2020-11-23 14:00:00 |
| 28 | D | 2020-11-21 03:30:00 | 2020-11-22 15:30:00 |
| 29 | E | 2020-11-20 18:30:00 | 2020-11-22 20:00:00 |
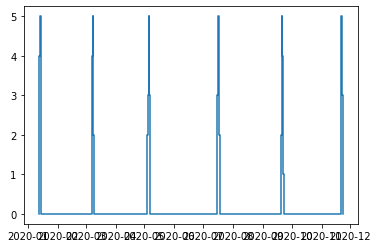
We’ll start by creating a Stairs object to model the number of components under maintenance at any point in time as a step function.
[3]:
components_under_maintenance = sc.Stairs(use_dates=True).layer(data.start, data.end)
components_under_maintenance.plot()
/home/docs/checkouts/readthedocs.org/user_builds/railing/envs/v1.6.4/lib/python3.8/site-packages/ipykernel/ipkernel.py:283: DeprecationWarning: `should_run_async` will not call `transform_cell` automatically in the future. Please pass the result to `transformed_cell` argument and any exception that happen during thetransform in `preprocessing_exc_tuple` in IPython 7.17 and above.
  and should_run_async(code)
[3]:
<AxesSubplot:>
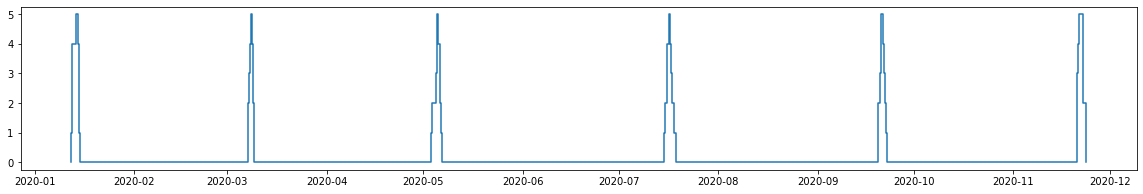
The default plot size is a bit too small so let’s create a bigger axes and pass it to the plot method.
[4]:
fig, ax = plt.subplots(figsize=(20,3))
components_under_maintenance.plot(ax)
[4]:
<AxesSubplot:>
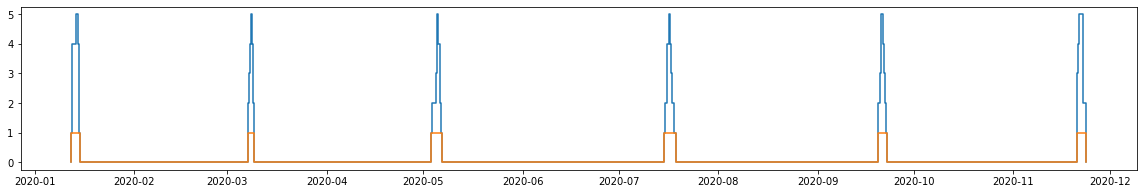
Our asset will be under maintenance whenever this step function is non-zero. There are several ways this can be achieved. Each option below returns a staircase.Stairs instance:
- asset_under_maintenance = components_under_maintenance > 0
- asset_under_maintenance = components_under_maintenance != 0
- asset_under_maintenance = ~(components_under_maintenance == 0)
- asset_under_maintenance = components_under_maintenance >= 1
- asset_under_maintenance = components_under_maintenance.make_boolean()
Let’s use the first option and plot it together with the first step function:
[5]:
asset_under_maintenance = components_under_maintenance > 0

fig, ax = plt.subplots(figsize=(20,3))
components_under_maintenance.plot(ax)
asset_under_maintenance.plot(ax)
[5]:
<AxesSubplot:>
Next we want to extract this interval data from our new step function. One way is to use the step_changes() method to get the points at which the function changes value:
[6]:
asset_under_maintenance.step_changes()
[6]:
{Timestamp('2020-01-12 08:30:00'): 1,
 Timestamp('2020-01-14 23:30:00'): -1,
 Timestamp('2020-03-07 07:30:00'): 1,
 Timestamp('2020-03-09 07:00:00'): -1,
 Timestamp('2020-05-03 14:00:00'): 1,
 Timestamp('2020-05-06 18:30:00'): -1,
 Timestamp('2020-07-15 05:00:00'): 1,
 Timestamp('2020-07-18 17:00:00'): -1,
 Timestamp('2020-09-19 15:30:00'): 1,
 Timestamp('2020-09-22 17:00:00'): -1,
 Timestamp('2020-11-20 18:30:00'): 1,
 Timestamp('2020-11-23 14:00:00'): -1}
However a better way to extract the data would be to use the to_dataframe method:
[7]:
asset_under_maintenance.to_dataframe()
[7]:
| start | end | value | |
|---|---|---|---|
| 0 | NaT | 2020-01-12 08:30:00 | 0 |
| 1 | 2020-01-12 08:30:00 | 2020-01-14 23:30:00 | 1 |
| 2 | 2020-01-14 23:30:00 | 2020-03-07 07:30:00 | 0 |
| 3 | 2020-03-07 07:30:00 | 2020-03-09 07:00:00 | 1 |
| 4 | 2020-03-09 07:00:00 | 2020-05-03 14:00:00 | 0 |
| 5 | 2020-05-03 14:00:00 | 2020-05-06 18:30:00 | 1 |
| 6 | 2020-05-06 18:30:00 | 2020-07-15 05:00:00 | 0 |
| 7 | 2020-07-15 05:00:00 | 2020-07-18 17:00:00 | 1 |
| 8 | 2020-07-18 17:00:00 | 2020-09-19 15:30:00 | 0 |
| 9 | 2020-09-19 15:30:00 | 2020-09-22 17:00:00 | 1 |
| 10 | 2020-09-22 17:00:00 | 2020-11-20 18:30:00 | 0 |
| 11 | 2020-11-20 18:30:00 | 2020-11-23 14:00:00 | 1 |
| 12 | 2020-11-23 14:00:00 | NaT | 0 |
Lastly we can filter the rows to only include those parts of the function which are equal to one, and drop the value column. We can then write the dataframe to csv if necessary.
[8]:
asset_under_maintenance.to_dataframe().query('value == 1').drop(columns='value')
/home/docs/checkouts/readthedocs.org/user_builds/railing/envs/v1.6.4/lib/python3.8/site-packages/ipykernel/ipkernel.py:283: DeprecationWarning: `should_run_async` will not call `transform_cell` automatically in the future. Please pass the result to `transformed_cell` argument and any exception that happen during thetransform in `preprocessing_exc_tuple` in IPython 7.17 and above.
  and should_run_async(code)
[8]:
| start | end | |
|---|---|---|
| 1 | 2020-01-12 08:30:00 | 2020-01-14 23:30:00 |
| 3 | 2020-03-07 07:30:00 | 2020-03-09 07:00:00 |
| 5 | 2020-05-03 14:00:00 | 2020-05-06 18:30:00 |
| 7 | 2020-07-15 05:00:00 | 2020-07-18 17:00:00 |
| 9 | 2020-09-19 15:30:00 | 2020-09-22 17:00:00 |
| 11 | 2020-11-20 18:30:00 | 2020-11-23 14:00:00 |